05 / VISUALIZATION
Using AI to Create Editable SVG Landscape Diagrams
Create quiet, precise landscape analysis drawings with AI: editable linework, restrained color, and a stormwater plan-and-section example.
Landscape diagrams need to explain spatial relationships: where people enter, where rainwater flows, and which areas need shade. AI can turn a description of those relationships into SVG, helping designers build a first drawing and revise its details.
The useful result is a drawing whose linework, planting, arrows, and labels remain editable. It should also read as a landscape drawing: terrain provides context, vegetation has a spatial role, and the water system is easy to trace. A clear prompt can establish that graphic language, while the designer supplies the site information and checks the analysis.
Why SVG suits landscape diagrams
SVG is a vector format that describes a picture with shapes, paths, and text. Pure vector content stays sharp when enlarged, making the same drawing useful at different sizes on a webpage, in a presentation, or on a display board. SVG is also text code, so its elements can be edited in a text editor or vector drawing software. MDN’s SVG guide
For designers, editability is especially useful. An arrow can move, a zone can change color, and a label can be rewritten. A vector editor such as Illustrator provides a visual way to refine the drawing and carry a consistent palette and line weight across a set of diagrams.
Keep an editable master with live text. Outlining letters changes them into paths, which can preserve their appearance but makes wording harder to revise. Font substitution may also change label widths, so check text and arrowheads after moving a file between applications. Adobe’s SVG saving options
What AI adds to the workflow
Because SVG is text, an AI assistant with code-generation capability can produce the drawing directly. Describe the content, layout, and visual hierarchy: fine gray context lines, lightly drawn planting, and a few muted blue drainage arrows. Ask for a complete SVG file with named groups and editable text.
This can reduce repeated drawing work. The same approach can produce a coordinated set of symbols, make alternative diagram versions, or apply a shared color and line-weight change. Accurate site boundaries and analysis conclusions still need to come from the designer’s information and review.
Common tasks include:
- Site analysis: entrances, pedestrian and vehicle circulation, views, and noise sources.
- Environmental strategies: drainage routes, rainwater collection, proposed shade locations, and airflow directions.
- Spatial explanations: functional zones, relationships between nodes, design strategies, and option comparisons.
- Drawing components: legends, north arrows, scale bars, and analysis icons. Include directional or scale information only when the source supports it.
Turn visual references into drawing rules
A reference image is most useful when its visual decisions can be described. In an academic landscape analysis drawing, those decisions often include generous white space, a few line weights, fine botanical or terrain marks, and selective color. Instead of asking only for a school’s style, tell the assistant which features of the reference to carry into the new drawing.
For this example, the graphic brief is:
- White space first. Keep a white background, open margins, and clear separation between the site plan, process section, and notes.
- A hierarchy of lines. Draw illustrative contours and soil texture lightly; give site objects a slightly stronger outline; reserve the clearest stroke for water routes.
- Restrained color. Use near-white gray for built surfaces, a pale sage wash for planted corridors, a warm gray for exposed ground, and a faint blue for water. Most of the page remains white.
- Vegetation as linework. Use irregular tree crowns with branching lines in plan, and stems, branches, roots, and sparse grass marks in section. Keep the detail subordinate to the analysis.
- Labels beside the drawing. Use short labels, thin leaders where needed, and small numbered steps. Let the site geometry occupy the center of the plan.
The plan carries the spatial explanation; the section adds the relationship between planting, ground, and water. This approach can guide other diagrams too, but the line density should always suit the final display size.
Example: a stormwater plan and process section
Imagine a site with a building at the upper left, parking at the upper right, an exposed-soil test plot at the lower left, and a detention basin at the lower right. Assume a general fall toward the lower right. The plan uses pale terrain lines and branching tree canopies to establish context. Narrow sage corridors connect the source areas to the basin, and slender gray-blue arrows identify the proposed runoff routes.
Below the plan, a diagrammatic process section follows the same sequence: collect water at a hard edge, convey it through planting, and hold it temporarily in a low basin. Roots, grass stems, a light soil texture, and a water-level line give the section a landscape character. It is a separate explanation of the process, rather than a section cut through a particular line on the plan.
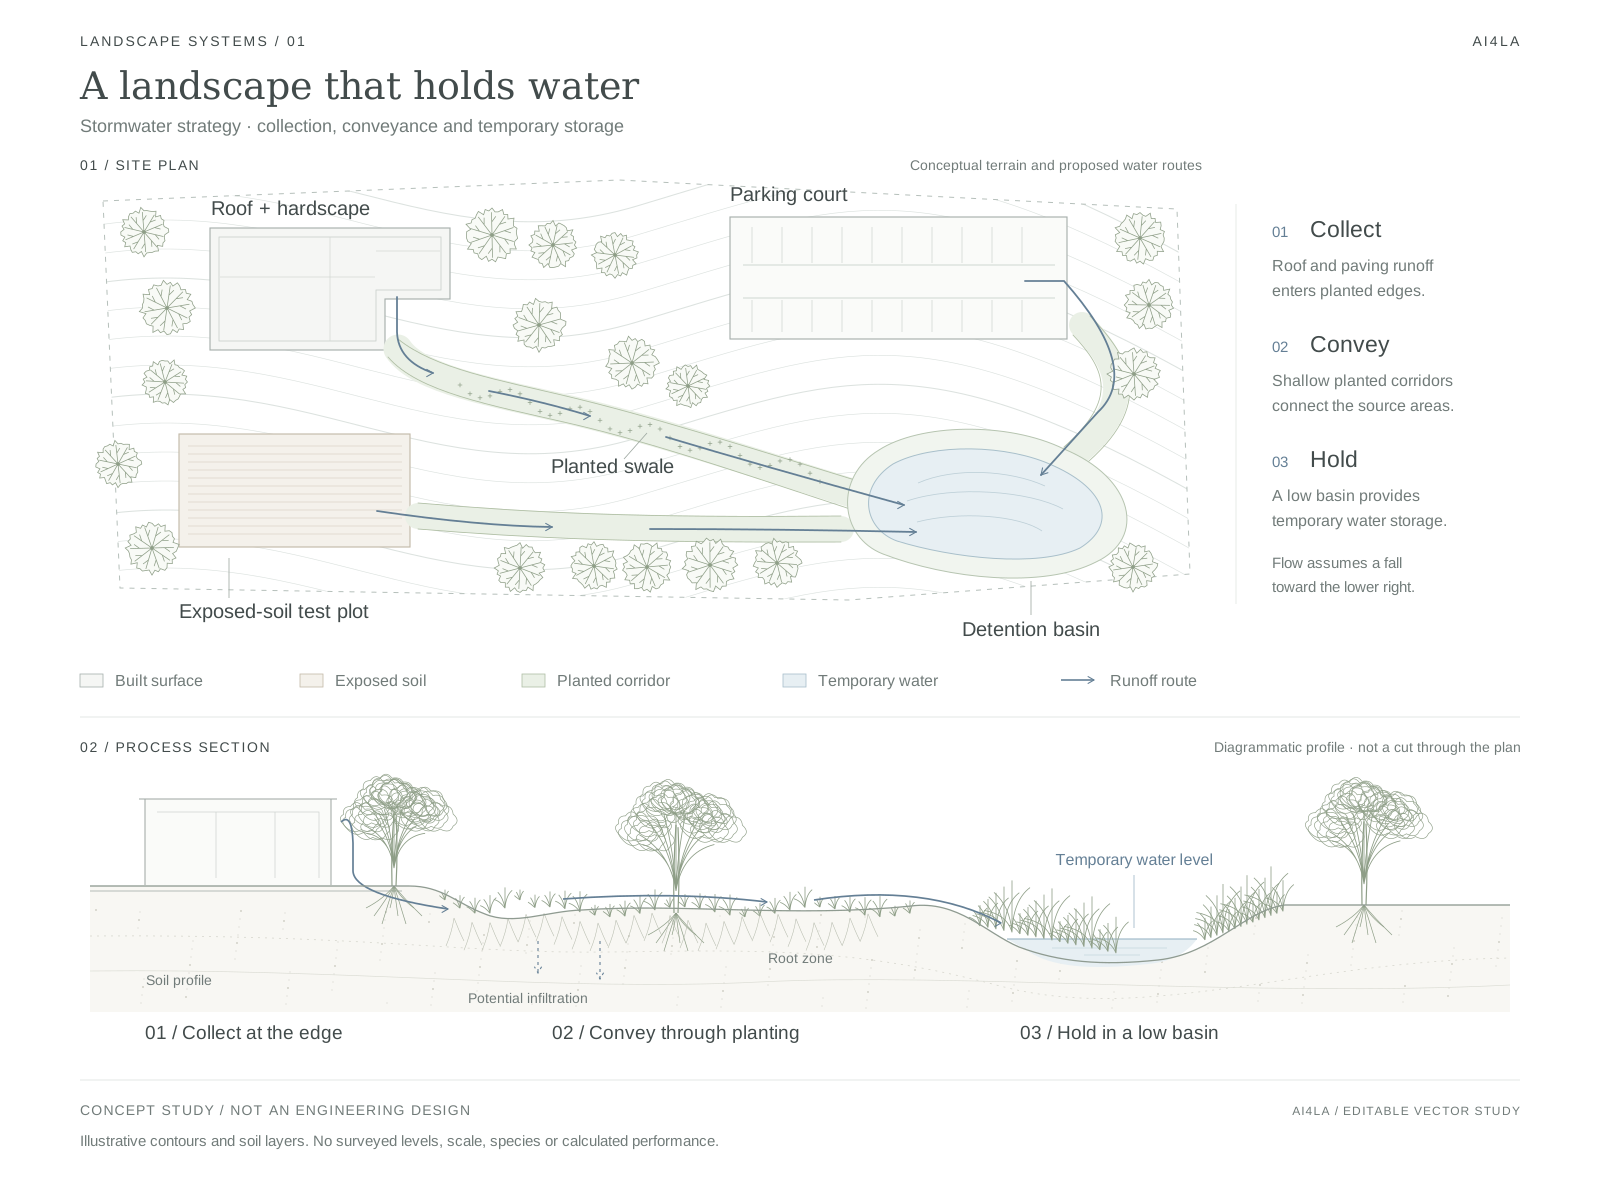
Figure 1. “A landscape that holds water”: a site plan and process section made entirely from editable vector linework and live text. Contours and soil layers are illustrative. On smaller screens, scroll across the drawing or open it at full size. Open full-size SVG · Download English SVG · Download Chinese SVG.
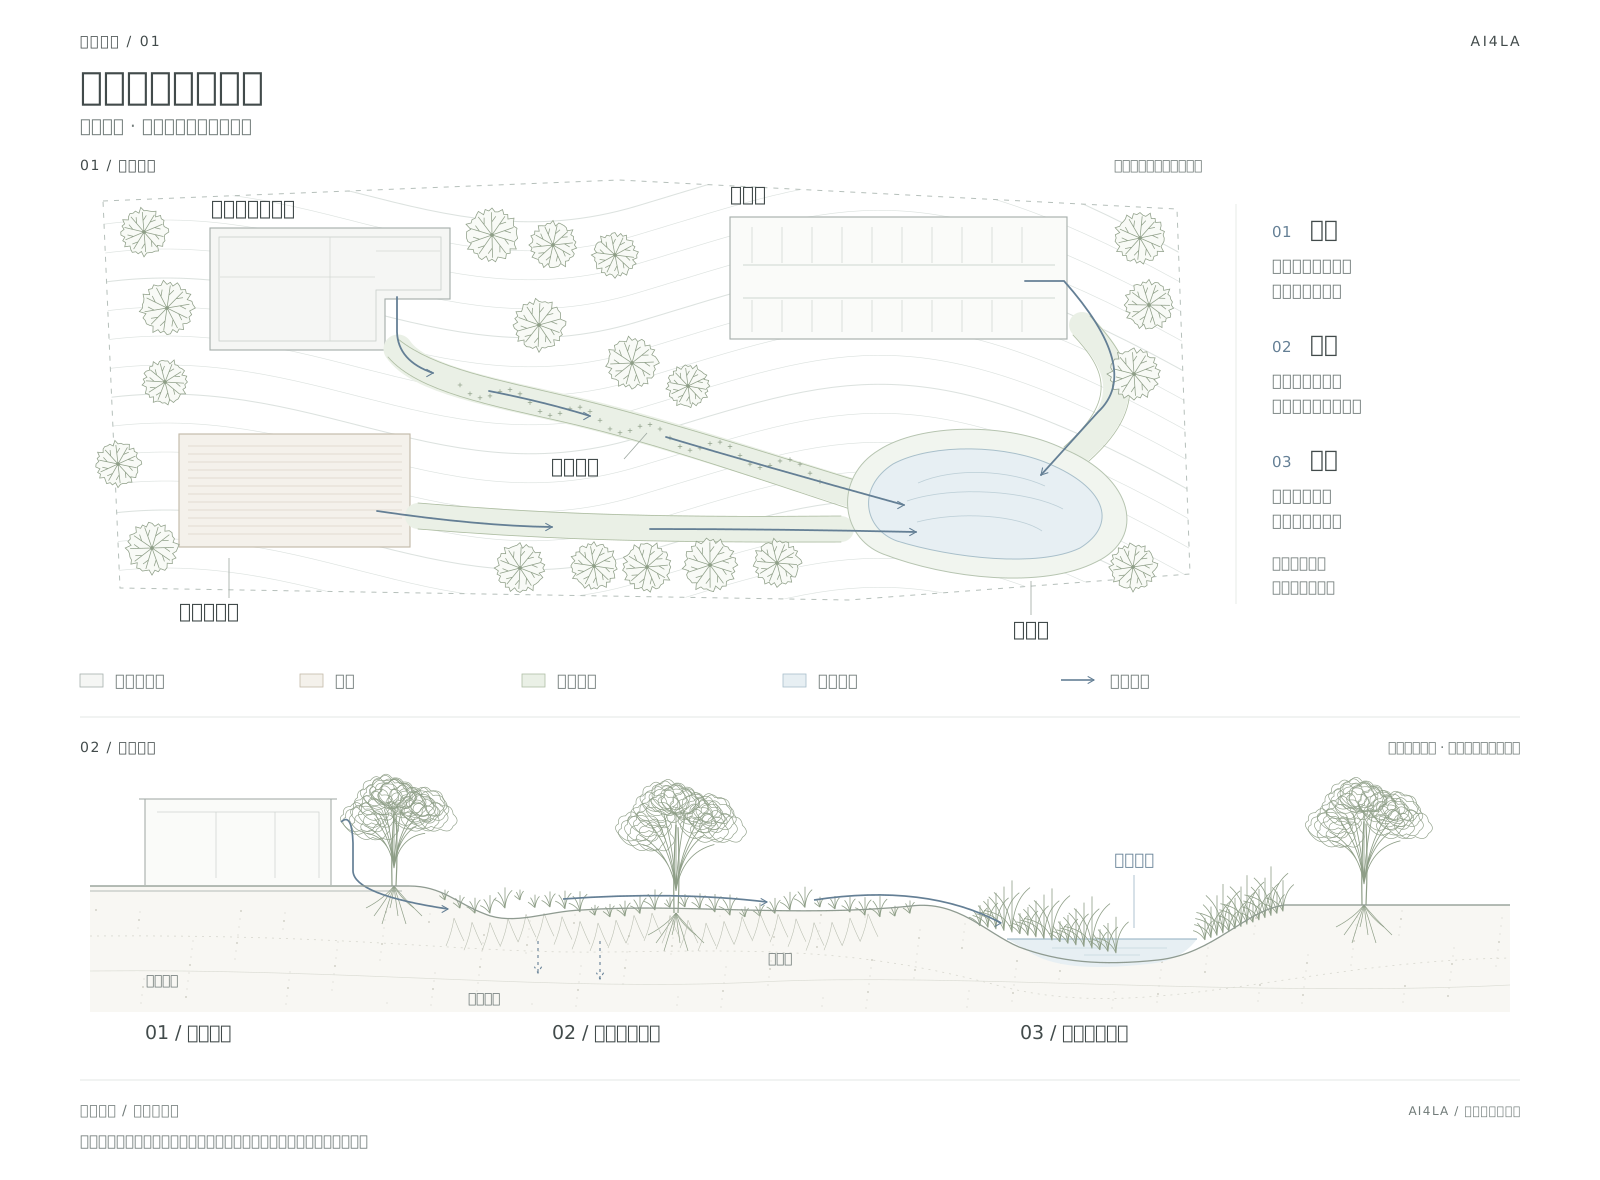
The file separates contours, land use, vegetation, swales, runoff, process section, labels, legend, and notes into named groups. Individual tree instances contain ordinary vector paths; they can be selected and edited independently. The English and Chinese versions share the same geometry and change only the text and font settings. The homepage thumbnail uses the same plan linework.
The example explains a proposed relationship between runoff collection and storage. Its contours, soil layers, and flow paths are illustrative. The dashed downward arrows indicate potential infiltration, subject to site conditions. For a real site, provide a base plan and elevation information, check the flow paths, and establish relevant design quantities separately. Without dimensional evidence, omit a scale bar. This drawing does not establish storage capacity, infiltration rates, plant suitability, or treatment performance.
A reusable prompt
Attach one or two visual references whose linework and composition you want to follow, and supply a base plan if the geometry should match an actual site. The following prompt requests a Chinese master and an English version with the same geometry, matching the two downloadable examples.
Create an editable landscape analysis plate titled “A landscape that holds water.” Output complete code that can be saved as an .svg file.

Use a 1600 × 1180 canvas with a white background and generous margins. Place a site plan in the upper portion, a narrow three-step explanation to its right, a compact legend below, and a diagrammatic process section across the lower portion. Keep labels short and outside the main site objects where practical.

Follow the graphic qualities of the supplied landscape analysis references: quiet composition, delicate terrain and botanical linework, sparse texture, and selective color. Translate those qualities into an original drawing. Use dark gray (#424b4b) for text, pale gray (#dce2df) for contours, pale sage (#eaf0e6) for planted corridors, warm gray (#f4f1eb) for exposed soil, pale blue (#e7eff3) for water, and muted gray-blue (#647f95) for flow arrows. Avoid heavy outlines, saturated fills, shadows, and oversized arrowheads.

Put a building at the upper left, parking at the upper right, an exposed-soil test plot at the lower left, and an irregular detention basin at the lower right. Add lightly drawn, explicitly illustrative terrain lines and a restrained number of trees with branching crown linework. Connect the source areas to the basin with narrow planted swales. Assume a general fall toward the lower right and show runoff with thin arrows, finishing each route inside the basin.

Use a line-weight hierarchy at this canvas size: approximately 0.6–0.8 px for background texture, 1–1.3 px for object outlines, and 1.7–1.8 px for runoff routes. Use simple open arrowheads. Keep fine detail sparse enough to remain legible when the plate is reduced for a webpage.

In the lower process section, show a built edge, a shallow planted corridor, and a low basin. Draw plants as fine stems and branches, add sparse roots and soil marks, and show a temporary water-level line. Label potential infiltration as conditional. State that this is a diagrammatic process profile, not a section cut through the plan. Do not invent elevations, species, storage quantities, or performance claims.

Use Chinese labels and the three steps “收集 / 输送 / 蓄水.” Include the note “概念研究,非工程设计;地形线与土层为示意。” Omit a north arrow and scale bar unless supplied site information supports them.

Keep every graphical element as editable vector geometry and all lettering as live text. Use named groups for contours, land-use, vegetation, swales, runoff, process-section, labels, legend, and notes. Use ordinary paths for individual tree instances. Do not use embedded raster images, filters, scripts, or external resources.

Return the complete SVG with namespace, accessible title and description, and viewBox. Check text bounds, label collisions, arrow direction, legend consistency, and readability at the intended presentation size. Also produce an English version with identical geometry and translated labels.
Revise the drawing without rebuilding it
Save the code as an SVG file and open it in a browser to inspect the overall composition. Then open it in a vector editor for visual adjustments, or ask the AI assistant to revise a specific group. A follow-up instruction might be:
Keep the site boundary, building, parking, plot, basin, swale paths, and runoff routes unchanged. Simplify the contours and planting texture if they compete with the water system. Change the labels to English and adjust label positions to avoid collisions. Preserve the plan-and-section composition, restrained palette, editable text, and named groups. Return the complete revised SVG.
Compare the revision with the original. Check that intended boundaries remain fixed, arrows still connect the intended areas, and the new labels fit. Review the diagram at its intended presentation size as well as enlarged. At full size, roots and small terrain marks should reward closer inspection; at webpage size, the collection-to-storage sequence should remain clear. If the detail disappears or creates visual noise, reduce its density or strengthen the relevant line weight.